Monitor
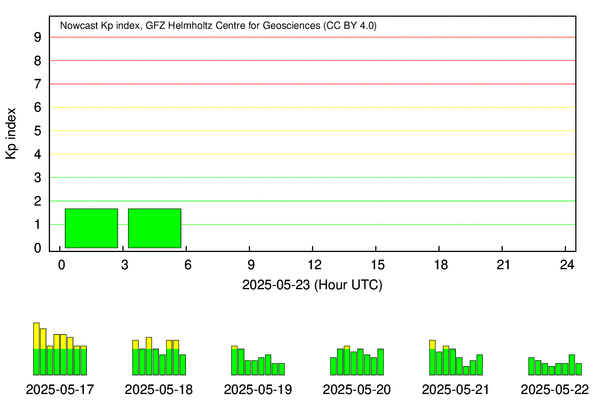
Activity over the last few days
In the graph below you see the activity over the last few days. This is the Kp-index over blocks of 3 hours, which is based on the measurements of magnetic sensors.
Green is low activity with local visibility of Northern Lights a high latitudes (around the polar circle: Northern Scandinavia, Iceland, Greenland, Northern Canada and Alaska). Yellow is increased activity. Red bars represent strong activity with potential visibility in lower longitudes.
Source: https://spaceweather.gfz-potsdam.de

1-hour Forecast
This map shows the Aurora prediction for the next 30-90 minutes. The precise forecast time is stated in the top-right corner and is based on the measured speeds of the solar wind. These measurements are taken by the ACE satellite, which is located between the Sun and Earth.
Source: NOAA Space Weather Prediction Center in Boulder, USA.

3-day Forecast
The expected Kp for the next three days in the area of the polar circle. The Kp is a value for the disturbance of the geomagnetic field. The more disturbance, the bigger likelihood of Northern Lights and its intensity. Green = low, red/purple = high.
